The pandemic-related lockdown is possibly the most dramatic public health intervention in NZ history. It helped achieve the elimination of community transmission of the COVID-19 virus in NZ. But it was also associated with 548 fewer total deaths than for the same period in 2019. Death rates (per 100,000 population) were also lower in 2020 than the three preceding years. There are a range of plausible reasons for this reduction (eg, fewer road crashes, fewer circulating respiratory infections) but we still need precise cause of death data (available in the future) to make more informed assessments.
We examined weekly death data for NZ up to 8 June 2020 (the first 23 weeks into the year) and made comparisons with the three previous years. Preliminary data on weekly deaths were from Statistics NZ [1].

Image by Holger Schué from Pixabay
The data suggest 548 fewer deaths in NZ for this 23-week time-period in 2020 when compared to 2019. When adjusted for NZ’s population size, the death rates were higher in each of the previous three years: in 2017 (291 deaths per 100,000 population); in 2018 (292); in 2019 (298) vs 282 per 100,000 in 2020 (see Appendix). The death rate for 2020 was statistically significantly lower than the rates in each of these previous years (eg, relative risk [RR] = 0.94; 95%CI: 0.92 to 0.97, p<0.000001 for year 2020 vs year 2019; see Appendix for more details).
Of note is that the deaths per week in 2020 were higher than in 2019 for the first two months of the year and then dropped below those of 2019 – particularly near the end of the Alert Level 4 phase of the lockdown (Figure 1). The 2020 weekly deaths were also generally lower than for 2018 after the first 7 weeks of lockdown.
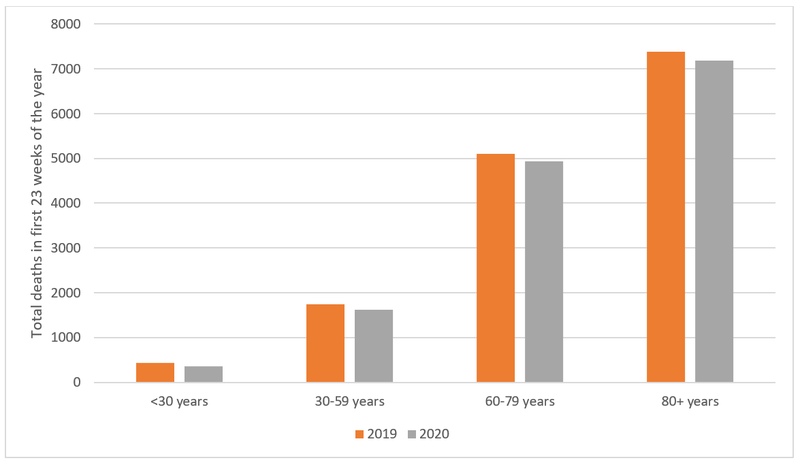
The reduction in deaths in 2020 vs 2019 was proportionately highest in the under 30-year age-group (83.1% of the 2019 level, 72 fewer deaths), then the 30-59 year age-group (93.2%, 119 fewer deaths), then the 60-79 year age-group (96.7%, 167 fewer deaths), and least in the 80+ age-group (97.4%, 190 fewer deaths) (see Figure 2).
Figure 1: Deaths per week for the first 23 weeks of 2018, 2019 and 2020 (and showing the various lockdown levels for the 2020 year)
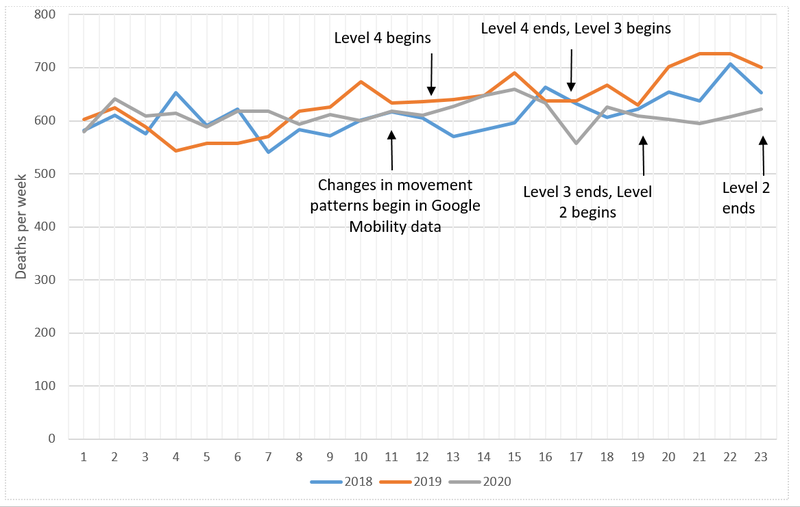
Notes: Alert Level 4 lockdown began on 26 March 2020 (1st full day); then switched to Alert Level 3 on 28 April (1st full day); then switched to Alert Level 2 on 13 May (1st full day); and then Alert Level 1 on 10 June (1st full day). In the week starting 16 March there were changes in mobility reported for New Zealanders in Google Mobility data ie, more time spent at home; less time in transit stations; less time in “parks”; and less time in “retail & recreation” settings [2].
Figure 2: Total deaths in the first 23 weeks of 2020 compared to the same period in 2019 by age-group
What might be the cause of the reduced death rate?
The lowered death rate in the first 23 weeks of 2020 was highly significant when compared with similar time periods in the preceding three years, suggesting that it is unlikely to be a chance finding. An obvious contributing factor for the lower weekly deaths during lockdown was the reduction in fatal road traffic crashes (41 fewer deaths compared to same time in 2019 to 5 July according to Ministry of Transport data [3]). However, other contributing possibilities may include:
- Reduced respiratory infectious disease transmission (a major cause of death in the elderly throughout the year). Indeed, FluTracking data for NZ shows a marked reduction in reported respiratory symptoms (fever and cough) up to June 2020 compared to the two preceding years [4].
- Reduced deaths associated with the marked decline in air pollution in NZ during the lockdown [5]. Similarly, NZ had the second highest reduction in its carbon emissions (at 41% reduction) out of a group of 69 countries [6].
- Reductions in various fatal occupational injuries (eg, forestry work declined temporarily due to hold ups in log exports to China).
- Reduced elective surgical procedures, a small proportion of which may result in fatal complications. For example, around 40% of Wellington ICU patients are typically from elective procedures and around 10% of all Wellington ICU patients die [7].
In the short-term, the above mechanisms appear to have overcompensated for any increased deaths from COVID-19 (22 deaths as per 9 July) plus potential direct lockdown effects (eg, suicides from psychological distress, home injury deaths), and effects of reduction in health care services (eg, for treating heart attacks and strokes). Nevertheless, it is plausible that in the longer-term there will be additional deaths that have arisen from lockdown-related delays in health services, including cancer treatment (as per this US study on cancer surgery [8]). Also, the post-pandemic situation has seen increased unemployment, and loss of a job is known to be associated with increased suicide risk [9]. Job insecurity is also associated with increased risk of cardiovascular disease [10]. But there is also evidence that the overall impact of recessions on health can be beneficial [11], since lives are saved by reduced road traffic crashes, reduced occupational injuries, and reductions in air pollution. Yet this can only be assessed over longer time periods and as argued by a prominent US epidemiologist with regard to the current COVID-19 pandemic: “Simply assessing current total excess mortality rates is insufficient because it will take time for the mortality consequences of unemployment, isolation, and depression to become manifest” [12].
A similar pattern seen in some other jurisdictions
These NZ findings are similar to those found for the 1 March to 25 April period among seven US states which had reduced deaths in the category of “deaths not attributed to COVID-19” (Iowa, Kentucky, Maine, New Mexico, Ohio, Rhode Island, and West Virginia) [13]. Another study for the 1 March to 30 May period reported a reduction in total deaths in six states that each had under 100 COVID-19 cases (ie, Alaska, Hawaii, North Dakota, South Dakota, West Virginia, and Wyoming) [14]. Some of these results could be chance findings, but as we suspect for NZ, some could represent the indirect impact of various restrictions (such as lockdowns) to prevent the spread of COVID-19.
Conclusions and next steps
These preliminary results for 2020 in NZ should provide the public with some reassurance that the lockdown did not have any marked (short-term) negative impact on the death rate – and indeed it appears the lockdown may have reduced the death rate. Nevertheless, the need for future lockdowns in NZ (eg, from border control failures) might be avoidable if mass masking and other measures are built into the early levels of the Alert Level system (as argued here: [15]). But despite these initial results, there is a critical need to repeat this analysis once additional data becomes available on the cause of death and on hospitalisations in 2020, and to subject all these data to an equity analysis (gender, ethnicity and deprivation). Indeed, final data on deaths will take about two years for coronial cases to all be closed (typically in the range of 3500 to 4000 deaths per year although only a small proportion of these involve inquests).
Appendix
Table A1: Deaths and death rates for the first 23 weeks of years 2017 to 2020 (preliminary mortality data for 2020)
| Year | NZ total population (March estimates) [16] (number) | Number of deaths in first 23 weeks (all ages) [1] | Crude death rate (per 100,000 population)* |
| 2017 | 4,751,600 | 13,812 | 291 |
| 2018 | 4,829,100 | 14,080 | 292 |
| 2019 | 4,905,300 | 14,638 | 298 (297**) |
| 2020 | 5,002,100 | 14,090 | 282 |
* The rate for 2020 was significantly different from that of each of the previous years (eg, relative risk [RR] = 0.94; 95%CI: 0.92 to 0.97, p<0.000001 for year 2020 vs year 2019; RR = 0.97; 95%CI: 0.94 to 0.99; p=0.002, for year 2020 vs year 2018; RR = 0.97; 95%CI: 0.95 to 0.99; p=0.004, for year 2020 vs year 2017).
** Rate adjusted when removing the 51 deaths from the mosque shootings in Christchurch in March 2019. This only changed the relative risk of deaths in 2020 vs 2019 slightly (RR = 0.95, 95%CI: 0.93 to 0.97; p=0.000002).
Table A2: Numbers of deaths by age-group for the first 23 weeks of years 2019 and 2020 (preliminary mortality data for 2020)
| Year | <30 years | 30-59 years | 60-79 years | 80+ years |
| 2019 | 426 | 1739 | 5095 | 7378 |
| 2020 | 354 | 1620 | 4928 | 7188 |
| Difference | 72 | 119 | 167 | 190 |
| % (2020/2019) | 83.1% | 93.2% | 96.7% | 97.4% |
References
- Statistics New Zealand. COVID-19 data portal (Health: weekly deaths). (Accessed 6 July 2020). stats.govt.nz/experimental/covid-19-data-portal.
- Google. COVID-19 Community Mobility Report: New Zealand March 29, 2020. google.com/covid19/mobility/.
- Ministry of Transport. Road deaths (data from 1 January to 5 July). transport.govt.nz/mot-resources/road-safety-resources/road-deaths/.
- ESR. FluTracking: Weekly Interim Report New Zealand (Week ending 28 June 2020). info.flutracking.net/about/.
- Longley I. Lockdown air quality keeps getting better. NIWA. (16 April). 2020; niwa.co.nz/news/lockdown-air-quality-keeps-getting-better.
- Le Quéré C, Jackson R, Jones M, Smith A, Abernethy S, Andrew R, et al. Temporary reduction in daily global CO2 emissions during the COVID-19 forced confinement. Nature Climate Change . 2020;(19 May). nature.com/articles/s41558-020-0797-x.
- Capital & Coast DHB. Capital & Coast DHB Intensive Care Unit (ICU). (Updated 11 February 2020). healthpoint.co.nz/public/intensive-care/capital-coast-dhb-intensive-care-unit-icu/.
- Sud A, Jones ME, Broggio J, Loveday C, Torr B, Garrett A, et al. Collateral damage: the impact on outcomes from cancer surgery of the COVID-19 pandemic. Annals of Oncology . 2020.
- Stuckler D, Basu S, Suhrcke M, Coutts A, McKee M. The public health effect of economic crises and alternative policy responses in Europe: an empirical analysis. Lancet . 2009;374(9686):315-323.
- Virtanen M, Nyberg ST, Batty GD, Jokela M, Heikkilä K, Fransson EI, et al. Perceived job insecurity as a risk factor for incident coronary heart disease: systematic review and meta-analysis. BMJ . 2013;347:f4746.
- Tapia Granados JA, Ionides EL. Population health and the economy: Mortality and the Great Recession in Europe. Health Econ . 2017;26(12):e219-e235.
- VanderWeele TJ. Challenges Estimating Total Lives Lost in COVID-19 Decisions: Consideration of Mortality Related to Unemployment, Social Isolation, and Depression. JAMA . Published online July 8, 2020. doi:10.1001/jama.2020.12187.
- Woolf SH, Chapman DA, Sabo RT, Weinberger DM, Hill L. Excess Deaths From COVID-19 and Other Causes, March-April 2020. JAMA . 2020.
- Weinberger DM, Chen J, Cohen T, Crawford FW, Mostashari F, Olson D, et al. Estimation of Excess Deaths Associated With the COVID-19 Pandemic in the United States, March to May 2020. JAMA Internal Medicine . 2020.
- Kvalsvig A, Wilson N, Chan L, Febery S, Roberts S, Betty B, et al. Mass masking: an alternative to a second lockdown in Aotearoa. N Z Med J . 2020;133(1517):8-13.
- Statistics New Zealand. Estimated population of NZ. (Updated 18 May 2020). stats.govt.nz/indicators/population-of-nz.
Image Upload
Add image